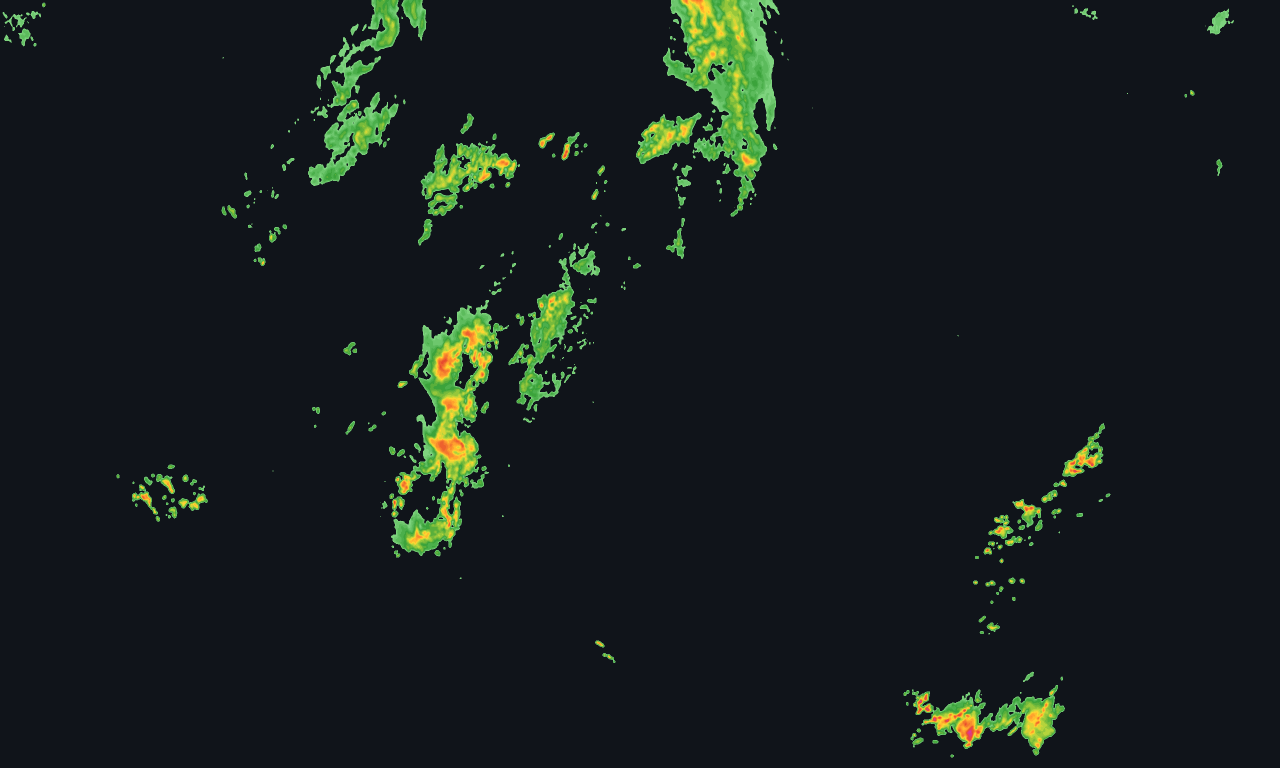
Radar
Composite reflectivity from NOAA MRMS, published every five minutes, plus thirty minutes of forecast frames. Smoothed into contour bands rather than the blocky government palette.

NOAA radar rendered every five minutes with a thirty-minute forecast. Rain totals, lightning and point forecasts behind the same key. Covers the whole country — Alaska, Hawaii, Puerto Rico and Guam included.
No card required. From $29/month after.
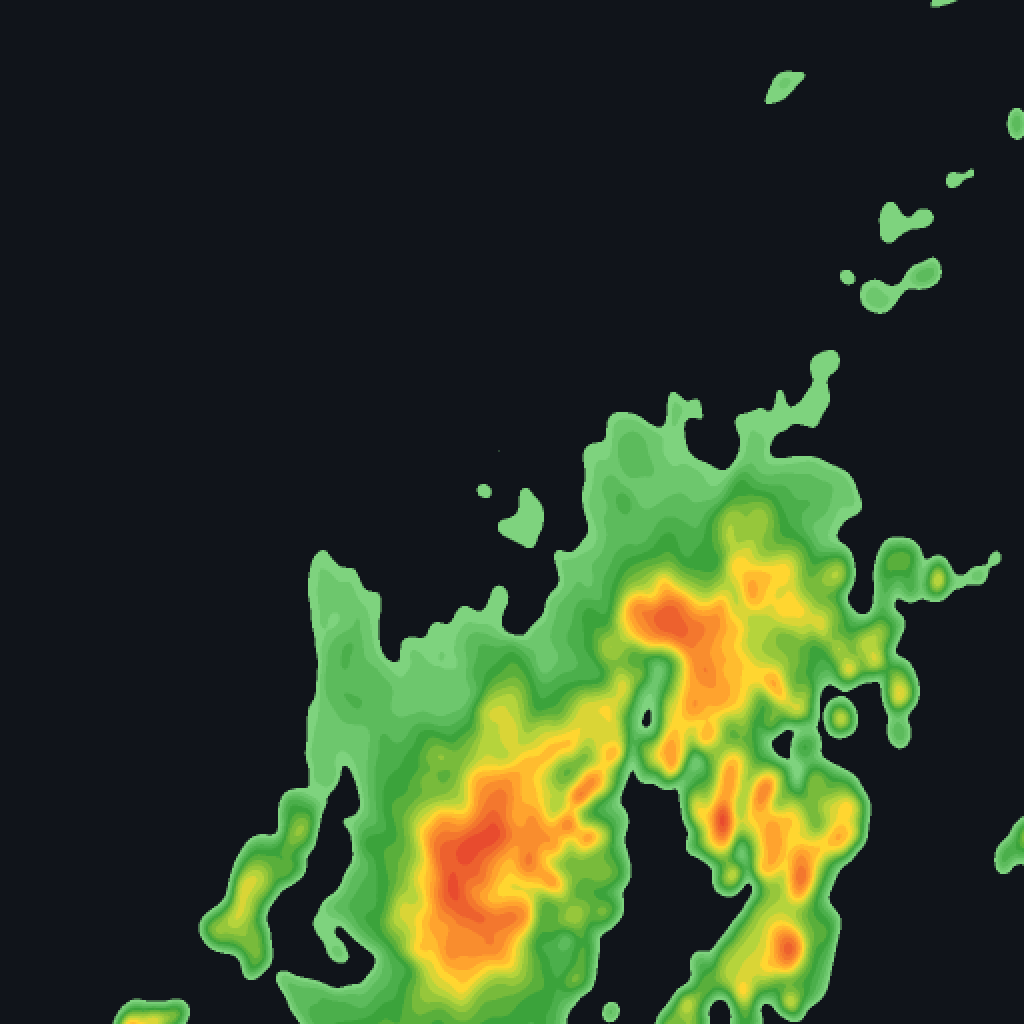
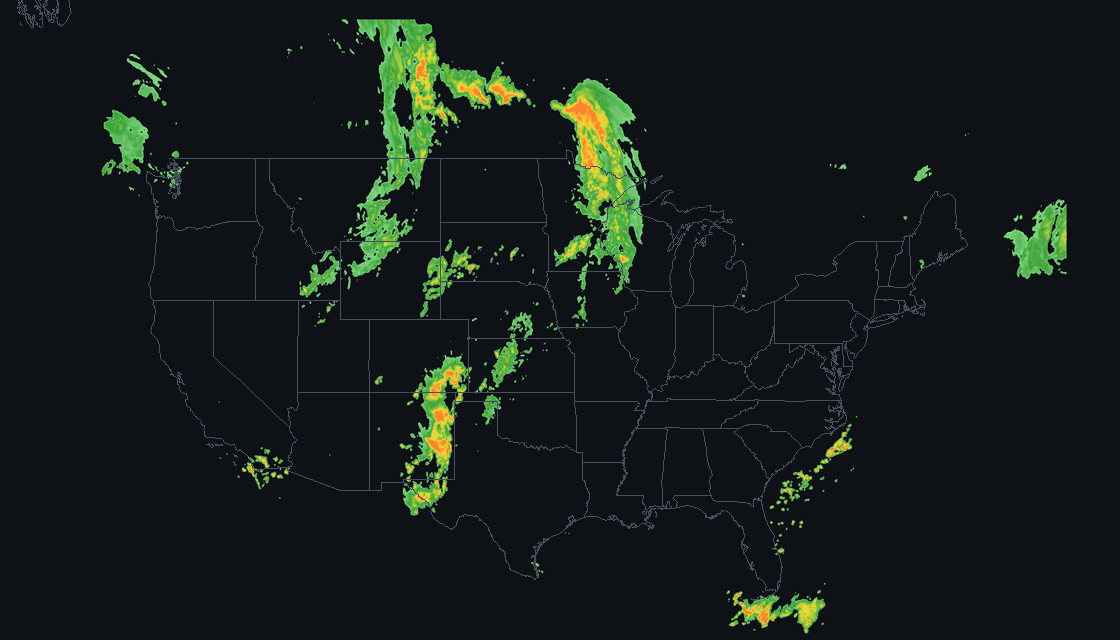
This is a recording, not a live feed — a public page cannot carry a key worth protecting. Your own integration gets frames this fresh every five minutes, with thirty minutes of forecast past the last one.
Composite reflectivity from NOAA MRMS, published every five minutes, plus thirty minutes of forecast frames. Smoothed into contour bands rather than the blocky government palette.
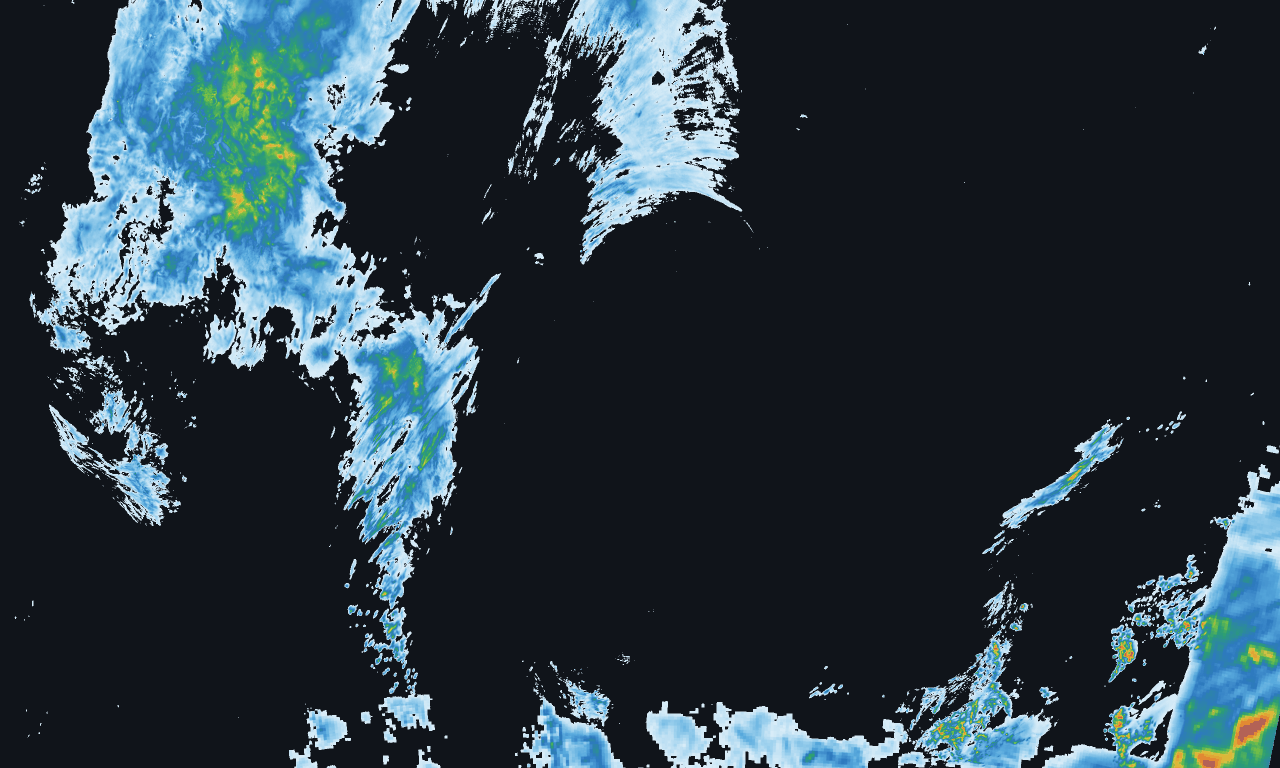
How much rain actually fell, corrected against ground gauges, over one hour or twenty-four. The layer that answers whether a river came up, not just whether it rained.

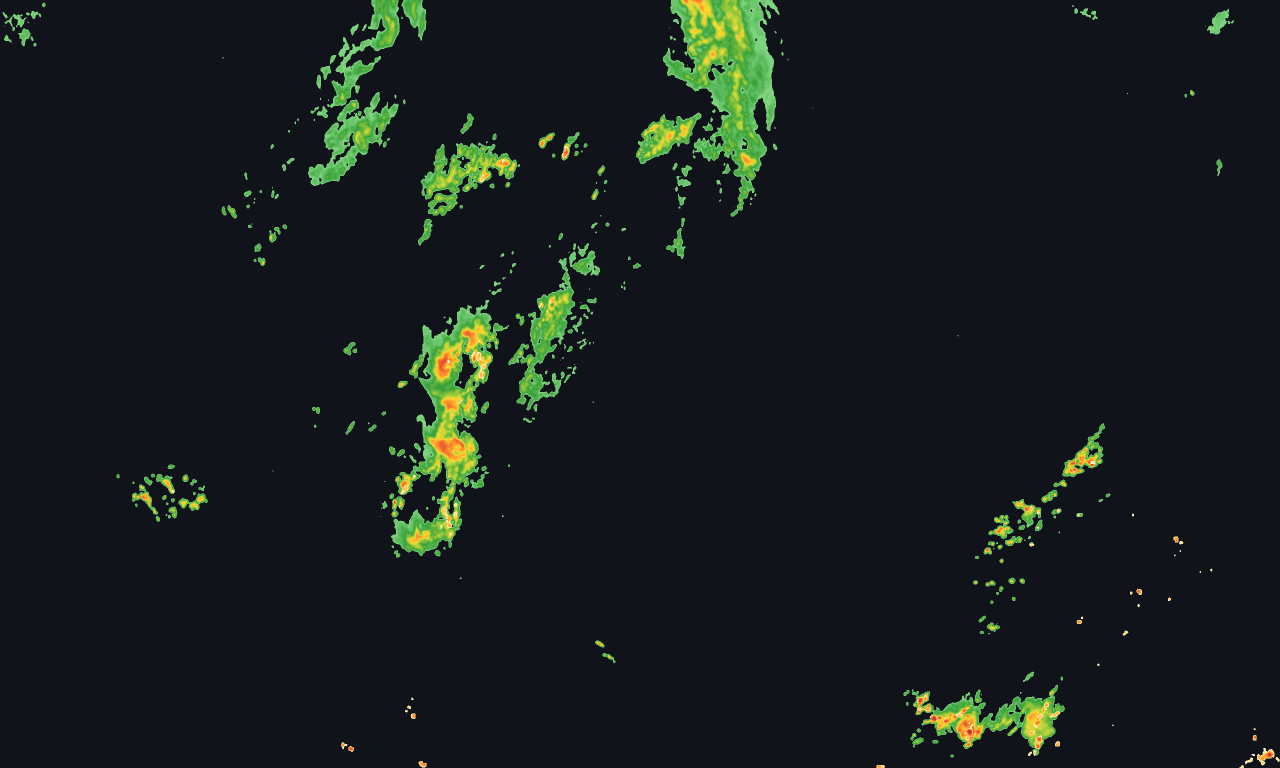
Satellite-detected total lightning — in-cloud as well as ground strikes — counted per cell over a rolling fifteen minutes and republished every five. In-cloud activity usually starts first.

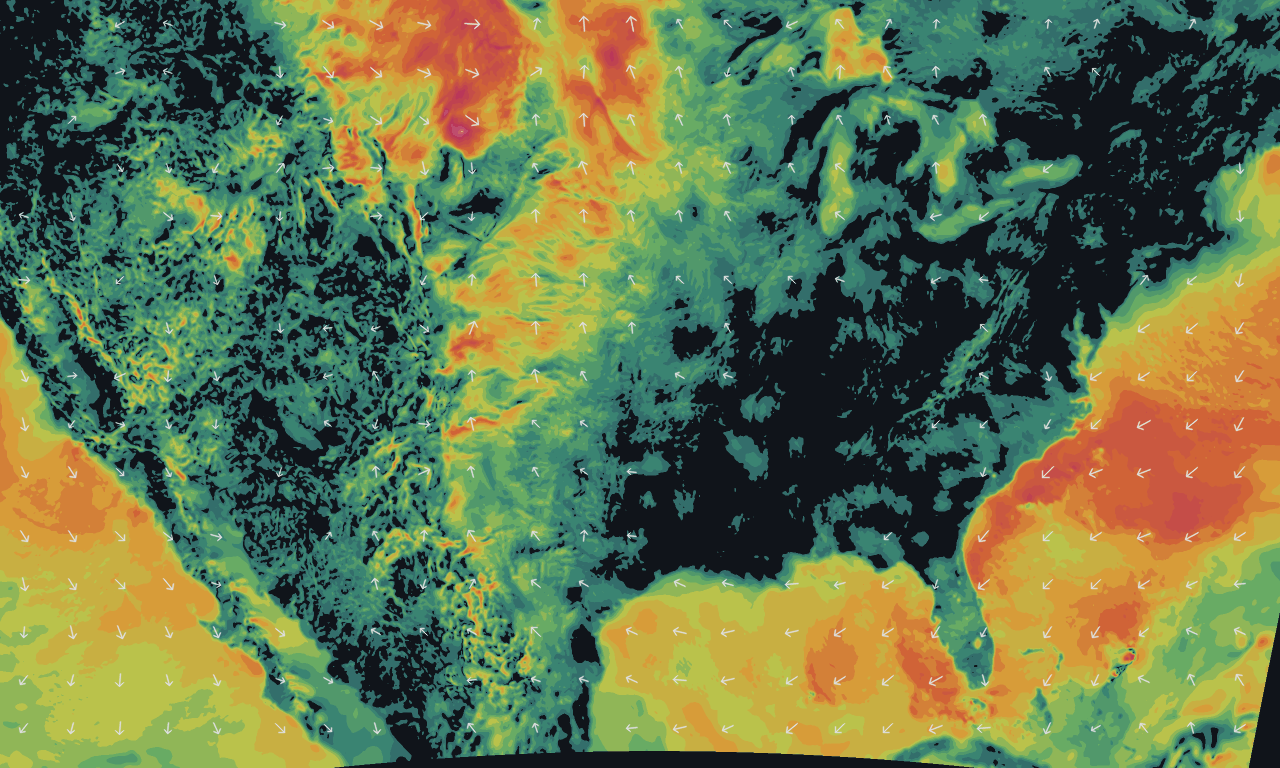
Surface wind speed and direction from the national analysis, hourly. Same tile scheme, same key.
Current conditions, hourly for twelve hours, and seven days, for any coordinate. Temperature, wind, humidity, pressure, precipitation probability.
GET /forecast/39.95,-105.36
What the weather actually was at a point and a moment — temperature, wind, pressure, precipitation. Back to 2013.
GET /history/39.95,-105.36/2026-10-18T15:00Z
Most radar providers stop at tiles. These are the reason customers stop needing a second vendor.
Better you read this now than find it in production.
$29/month
$99/month
Every account starts with a 14-day trial, no card. Errors — your 401s and 404s — are never billed. Need more than five million, or something not listed? Ask.
# what frames exist right now
curl -H "x-api-key: $KEY" \
  https://splitshotweather.com/manifest/composite.json

# then a tile, using a timestamp from that manifest
https://splitshotweather.com/tiles/composite/{ts}/{z}/{x}/{y}.png
Standard XYZ tiles — drop the template into Mapbox, MapLibre, Leaflet or anything else that speaks slippy maps. Full reference in the docs.